


R-Lab
最新の R-Lab ソフトウェア
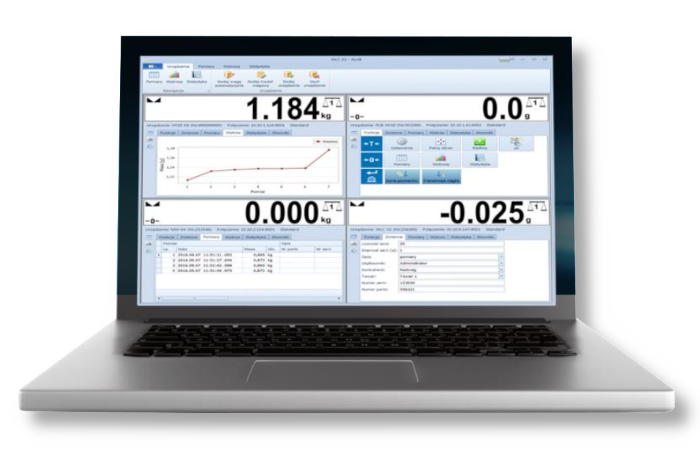
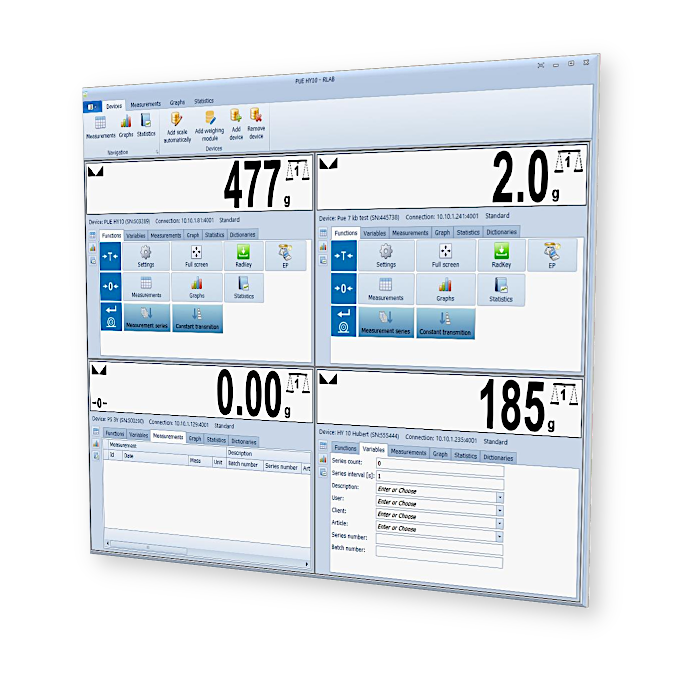
R-Lab ソフトウェアは、RADWAG 製の電子天秤から送信された測定データを収集・表示し、統計解析を行うことができます。本ソフトウェアは最大 20 台の天秤と同時に動作し、データの保存は手動または自動で行えます。
収集された情報は、詳細な表形式のレポートやグラフで表示されます。
グラフの種類:
- 測定グラフ(統計データ付き)
- ガウス分布関数(確率分布)およびヒストグラム
- 安定性グラフ(連続する測定値の差異)
- オールインワングラフ
本ソフトウェアでは、特定の測定シリーズに対するレポートの生成が可能であり、以下のような多様なフィルタリングオプションを提供します(フィルタリング項目: 日付、質量、単位、説明、選択したデバイスのリスト)。R-Lab は現在のセッションおよび当日のレポートを表示する機能も備えています。
ソフトウェアが生成する統計データには、測定回数、最小値および最大値、平均値、 中央値、標準偏差および平均偏差、分散、分散および偏差の推定値、計量合計 が含まれます。データは、 PDF, HTML, MHT, RTF, XLS, XLSC, CSV, テキスト、およびグラフィックファイルの形式でエクスポート可能です。
最新のソフトウェアバージョン: 2018.4.11

 Albanian
 Danish
 Nederlandse
 Estonian
 Finnish
 Hungarian
 Icelandic
 Kazakh
 Latvian
 Lithuanian
 Macedonian
 Norwegian
 Portuguese
 Romanian
 Russian
 Slovak
 Slovenian
 Swedish
 Ukrainian
 Serbian
 Montenegrin
 Português (Brasil)
 Deutsch
 English
 Español
 Français
 Italiano
 Polski
 Türkiye
 Česky
Česky USA
USA 中文
中文


